Contribution margin for manufacturers and distributors: the metric that identifies which products and customers are truly profitable.By Enrico Sieni, Revify Analytics. September 1, 2026. About 12 minutes.
The short version. Contribution margin is what a unit leaves behind after every cost that moves with it: COGS, freight-out, pick-pack, commissions, card fees, returns, rebates. Gross margin only nets COGS, which is why the two numbers rank your catalog differently. This guide is for owners and finance or ops leads at mid-market manufacturers and distributors who suspect the margin report is hiding something. It covers the formula, the difference from gross margin, a 6-step method, and a worked three-SKU example in which the number-one seller shows a 38% gross margin and loses $0.49 on every unit, $29,400 a year. It closes with the playbook for acting on what you find.
What is contribution margin, and what does it actually count?
Contribution margin is defined as net price minus all variable costs, calculated per unit or in total. Variable costs are those incurred only when a unit is shipped, such as the cost of goods, outbound freight, pick and pack labor, sales commissions, card fees, expected returns, and applicable rebates. The remaining amount covers fixed costs, and any excess becomes profit.
There are two practical forms: the unit figure, expressed as dollars per unit, and the contribution margin (CM) ratio, which is the unit figure divided by net price. This ratio enables direct comparison between SKUs of different prices. For theoretical background, refer to Corporate Finance Institute’s accounting guide. The practitioner version is summarized as follows:
Unit contribution margin = net price – (COGS + freight-out + pick-pack + commission + other variable costs)
It is important to use the correct inputs. Net price refers to the pocket price, which is the amount after discounts and rebates, not the list price from your ERP system. Including all relevant variable costs is essential to obtain an accurate result.
Contribution margin does not answer the question, “How profitable are we?” That is addressed by your P&L. Instead, it identifies which SKUs, orders, and customers contribute positively to the business and which generate losses.
Why does a 38% gross margin SKU lose money?
Gross margin is limited because it excludes several key costs. For example, the economy SKU below has a $12.00 net price and $7.44 COGS, resulting in a 38% gross margin. However, additional costs not captured in gross margin include $2.15 for freight-out (due to small, heavy drop orders), $1.85 for pick-pack (with an average order of six units), $0.60 for commission, and $0.45 for returns and card fees. The total variable cost is $12.49, exceeding the $12.00 price, so the SKU loses $0.49 per unit shipped.
None of that appears on an invoice line. Freight absorption hides in the freight ledger. Pick-pack hides in the warehouse payroll. Rebates accrue in a different account months later, which is how rebate programs quietly destroy margin while every deal looks fine at signing. The leak categories are predictable; we walk through them in our margin leakage guide.
Two background conditions make this worse right now. First, costs are moving: US producer prices for final demand rose 4.7% in the twelve months through July 2026, per the Bureau of Labor Statistics. A price file that has not moved this year is a real-terms price cut. Second, discounting is loose: 61% of companies run deal discounting on manual, inconsistent processes, per the 2025 RGA Maturity Report. Rising variable costs plus unmanaged giveaways are exactly the combination that pushes thin lines below zero without anyone deciding anything.
What is the difference between contribution margin and gross margin?
Both metrics start with revenue, but differ in scope. Gross margin subtracts only COGS, while contribution margin subtracts all variable costs associated with volume.
Gross margin
Contribution margin
Subtracts
COGS only
COGS plus freight-out, pick-pack, commissions, fees, returns, rebates
Answers
What does production or purchasing cost us?
What does each unit actually leave behind?
Lives in
Every ERP report
Almost nowhere by default; you build it
Misleads when
Cost-to-serve varies by SKU or customer
Rarely, if the variable cost list is honest
Decides
Purchasing and supplier questions
Keep, fix, or fire questions
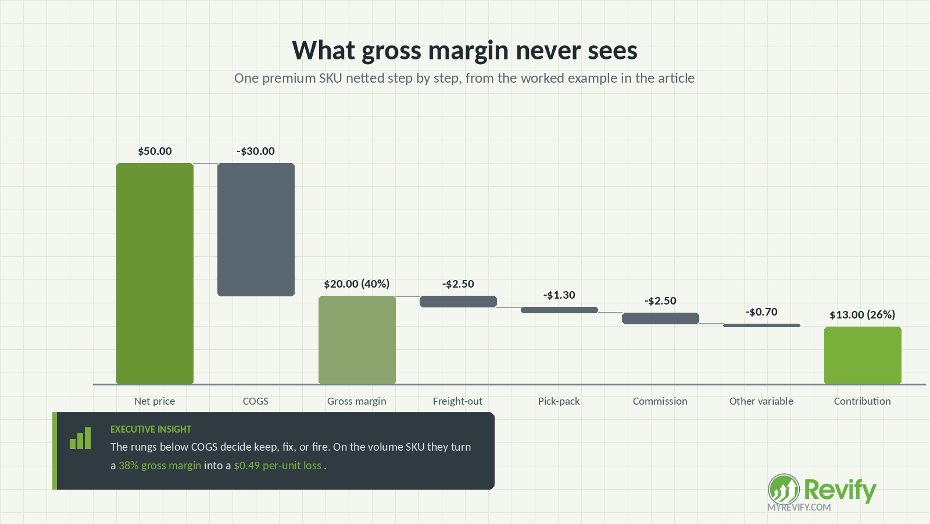
Visualize the process as a ladder: list price at the top, followed by deductions for discounts and rebates to reach pocket price. Subtracting COGS yields gross margin, and further deductions for freight, handling, commissions, fees, and returns lead to contribution margin. Each step represents actual costs, with those below COGS often overlooked. The previous article addressed the top half of this ladder; this article focuses on the lower half.
Alt text: Cost ladder from list price down to contribution margin for a distributor SKU
A key caution: using list prices instead of pocket prices introduces errors throughout the analysis. According to the 2025 RGA Maturity Report, 50.7% of surveyed companies lack a price waterfall and cannot make this correction.
How do you run a contribution margin analysis in 6 steps?
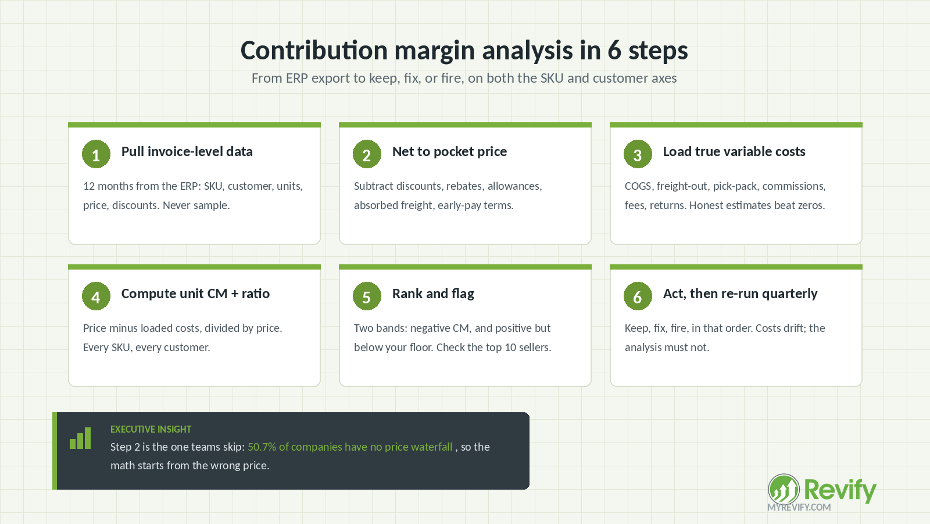
To conduct this analysis, gather invoice-level data and use a spreadsheet. The initial process typically requires about one week. The recommended sequence is as follows:
Extract twelve months of invoice-level data from your ERP, including SKU, customer, units, invoiced price, and discounts. Use a full year to account for seasonality. Avoid sampling, as losses often occur in less frequent transactions.
Adjust each price to the pocket price by subtracting both on-invoice discounts and off-invoice incentives, such as accrued rebates, promotional allowances, absorbed freight, and early-pay discounts. This step is often overlooked but is critical for accurate results. Our guide to price realization without a pricing team details where to find each figure.
Load true variable costs per line. COGS from the item master, freight-out from the freight ledger allocated per shipment, pick-pack from warehouse cost per order line, commission rates, card fees, and a returns allowance. Approximate honestly rather than precisely omitting: a defensible $1.85 pick-pack estimate beats a confident zero.
Calculate the unit margin and the ratio for each SKU and customer. Subtract loaded costs from price, then divide by price. Apply this calculation both by SKU and by customer.
Rank SKUs and customers on both axes and flag two categories: negative (lines that lose money per unit) and below floor (positive margin but below your minimum threshold, typically 10% for distributors). Significant volume lines may fall into these categories unexpectedly.
Address flagged lines in sequence: keep, fix, or remove, as detailed in the following sections. Re-run the analysis quarterly, as costs and product mix change over time. Annual analyses quickly become outdated.
Alt text: Six-step contribution margin analysis method for manufacturers and distributors
How do you build a contribution margin analysis in Excel?
Business intelligence software is not required to begin; a well-structured workbook is sufficient for a mid-market portfolio. Create one row per SKU with columns for units, net price, COGS, freight-out, pick-pack and handling, commission percentage, and other variable costs. Calculate the unit margin, ratio, and total contribution per line, and include gross margin percentage in an adjacent column to track ranking changes. Apply the same structure by customer, using annual figures.
Add two flag columns: one for negative margins and one for positive margins below your threshold. Start by building the three-line example provided in this article and verify that your formulas match the sample results before importing your own data. If you prefer to see this analysis applied to your actual invoice data, our team can assist.
What does a worked example look like?
The following example uses a composite mid-market distributor with three product lines over the trailing twelve months. The data structure is based on real engagements, but the numbers have been modified for illustration purposes and do not represent any specific client.
Line
Units
Net price
COGS
Variable cost beyond COGS
Gross margin
Unit CM
CM ratio
Total CM
A, premium
12,000
$50.00
$30.00
$7.00
40.0%
$13.00
26.0%
+$156,000
B, workhorse
40,000
$25.00
$17.50
$3.25
30.0%
$4.25
17.0%
+$170,000
C, volume trap
60,000
$12.00
$7.44
$5.05
38.0%
-$0.49
-4.1%
-$29,400
Portfolio totals: $2,320,000 of revenue, $813,600 of gross margin at 35.1%, and $296,600 of total contribution at 12.8%.
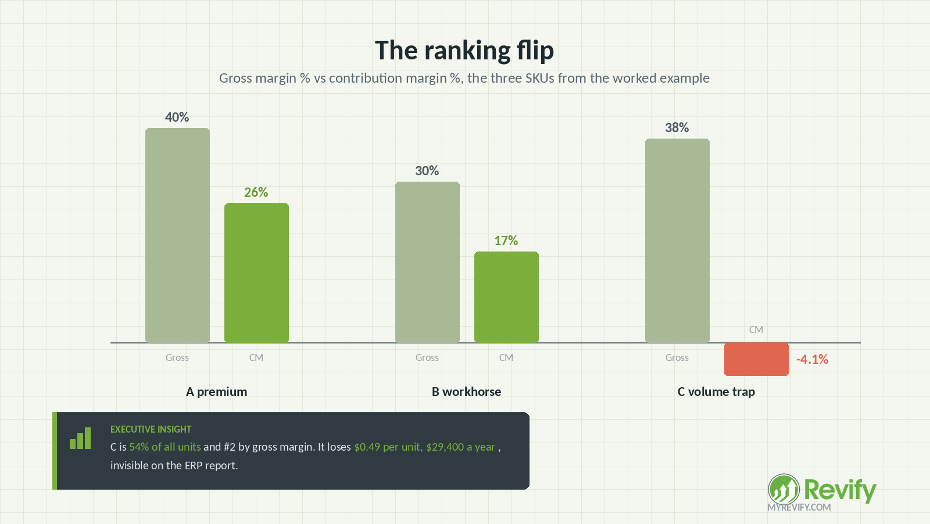
Compare the two margin columns: gross margin ranks SKU C as second best at 38.0%, ahead of SKU B at 30.0%. However, the contribution margin ratio reverses the ranking: A at 26.0%, B at 17.0%, and C last at minus 4.1%. SKU C is the highest-volume item, representing 54% of shipments, yet it loses $0.49 per unit, totaling $29,400 annually. These losses are not visible in standard ERP reports because the relevant costs are not captured on the invoice.
Alt text: Ranking flip between gross margin and unit economics across three distributor SKUs
To address this, implement two changes for SKU C: increase the price from $12.00 to $13.00 (an 8.3% increase) and set a minimum order quantity to raise the average order from 6 to 12 units, reducing pick-pack costs from $1.85 to $0.95 per unit. The new unit margin becomes $1.36, or a 10.5% ratio. At current volume, this results in $81,600 annual contribution, a $111,000 improvement for this SKU. Even with a 15% reduction in volume, the line would still contribute approximately $69,000.
Once the table is established, you can easily calculate break-even revenue by dividing fixed costs by the portfolio’s weighted average contribution margin ratio. In this example, $240,000 of fixed costs at a 12.8% ratio requires approximately $1.88 million in revenue to break even, compared to $2.32 million actual revenue. Changes in product mix will affect this figure.
How do you act on contribution margin: keep, fix, or fire?
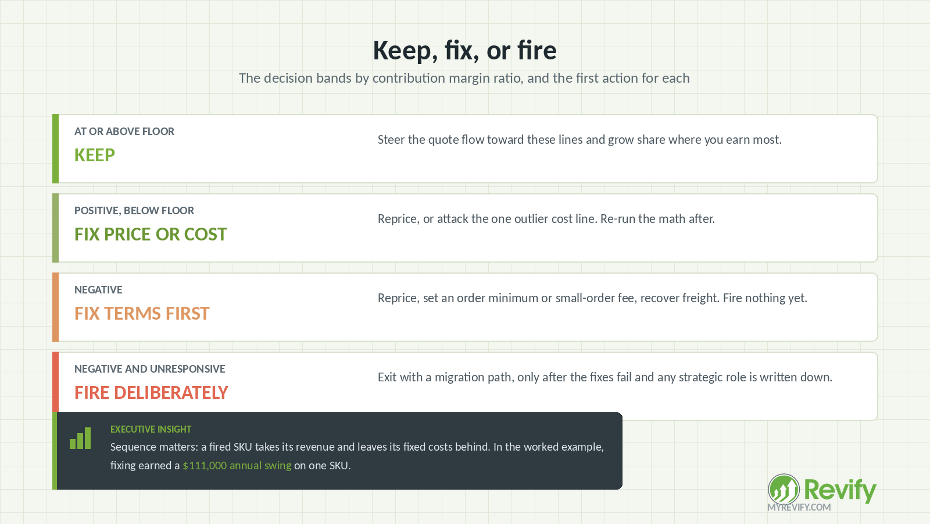
In sequence. Keep what you earn. Fix what can earn. Fire what will not respond. The order matters because a fired SKU takes its revenue with it and leaves its fixed costs behind.
Band
The question to ask
First action
Owner
CM ratio at or above floor
Is share growing where we earn most?
Steer the quote flow toward these lines
Sales leadership
Positive but below floor
Which cost is out of line, or is the price stale?
Reprice, or attack the one outlier cost
Commercial lead
Negative CM
Would a reprice, MOQ, small-order fee or freight recovery turn it?
Run the fix math before any exit decision
Commercial lead plus ops
Negative and unresponsive
Does it earn its keep strategically, documented?
Exit deliberately with a migration path
Leadership
The fix toolkit is short and proven: a reprice with a defensible story, and our price increase letter templates make that conversation easier; order minimums and small-order fees that repair order economics; freight recovery terms; and tier floors so the discount ladder cannot recreate the problem, which is the discipline in our wholesale pricing guide. For the fire path done properly, sequence and all, see SKU rationalization. The same bands apply to the customer axis, where the parallel playbook is customer profitability analysis.
For example, a mid-market wholesale distributor identified approximately $6 million in annual sales below a 5% gross margin floor, with a significant portion being negative, after segmenting customer-SKU combinations from invoice data. By repricing these transactions to the floor in stages and protecting intentional loss leaders, the company recovered about $0.7 million in gross margin and increased net sales by approximately $0.4 million, with only 6% volume attrition. A monthly monitoring process now flags below-floor transactions at invoicing to maintain improvements.
Alt text: Keep fix or fire decision bands by contribution margin ratio
The benefits of this discipline are significant. Revify’s analysis of over 2,000 public companies found that a 1% increase in net price raises operating profit by a median of 6.4%. Addressing negative lines delivers this type of improvement, especially where it is most critical.
Which mistakes break a contribution margin analysis?
Mistake: Using gross margin as a profitability ranking. Gross margin measures purchasing efficiency, not overall profitability. As shown in the example, SKU C has a 38% gross margin but a negative contribution margin.
Mistake: Immediately discontinuing negative lines. Fixed costs remain even if a SKU is removed. Attempt to fix by repricing, setting minimums, or recovering freight before discontinuing lines that remain unprofitable.
Mistake: Assuming higher volume will offset a low margin. A negative unit margin only increases total losses. For example, selling 60,000 units at a $0.49 loss each results in a $29,400 loss.
Loading COGS only and calling it variable cost. That is gross margin wearing a costume. The freight, handling, commission, fee, and rebate lines are where the answer changes.
Mistake: Conducting the analysis only once. Costs and product mix change over time, so quarterly updates are recommended. Re-running the analysis on the same workbook is efficient and effective.
Should contribution margin live in Excel, the ERP, or with a managed service?
Option
Good fit when
Watch out for
Excel workbook
First pass, up to a few hundred SKUs, one owner
Manual refresh; version sprawl
ERP report
Clean item and cost masters, IT capacity
Freight and rebates usually missing from the cost model
BI dashboard
Data warehouse exists, analyst on staff
Months of build; the variable cost logic still has to come from somewhere
Managed service
No pricing or analytics team, need it running monthly
Choose one that transfers the method, not a black box
Start in Excel regardless; the workbook described above is the first pass. If the analysis changes decisions, graduate it. And pair it with its sibling diagnostic: this analysis tells you which lines pay, while price-volume-mix analysis tells you which lever moved the total. Together, they turn a margin argument into an hour of arithmetic.
Frequently asked questions
What does the number mean in simple terms?
Contribution margin represents the amount remaining from each unit after all costs directly associated with selling that unit, including product cost, freight, handling, commissions, fees, expected returns, and rebates. This remainder first covers fixed costs, then contributes to profit. If the margin is negative, each additional unit increases total losses.
How do you calculate contribution margin?
The unit figure equals net price minus all variable costs per unit. Use the pocket price, after discounts and rebates, not the list. The ratio is the result divided by the net price. Total contribution is the unit figure times units sold. The worked example above runs all three forms on real numbers.
What is a good contribution margin ratio?
There is no universal benchmark for the contribution margin ratio, as it varies by business model. For mid-market distributors, a 10% minimum per line is a practical starting point, with the portfolio average typically higher. The key is to identify which lines fall below your internal threshold and understand the reasons.
What is the difference between contribution margin and gross margin?
Gross margin subtracts only COGS from price, while contribution margin also deducts freight-out, pick-pack, commissions, fees, returns, and rebates. Gross margin addresses purchasing efficiency, whereas contribution margin informs decisions to keep, fix, or discontinue a line. A SKU may rank highly on one metric and poorly on the other.
Can the margin be negative, and what do you do about it?
Yes, and more often than most teams expect, usually on high-volume economy lines with heavy freight and small orders. Fix before fire: reprice, set a minimum order quantity or small-order fee, recover freight, re-run the math. Exit only the lines that stay negative after honest fixes.
The principle underneath all of it
You cannot keep a margin you have never measured to the unit. Every report in the building averages across SKUs, across customers, across orders. Averages are where negative lines hide, and they hide well, because the biggest ones sit inside your biggest sellers. This analysis is the anti-average. It hands every unit its own bill and lets the portfolio argue from evidence. The distributors who run it quarterly do not have fewer surprises because they are lucky. They have fewer surprises because the surprises get invoiced monthly, in a workbook, at a size where fixing them is a price change and not a restructuring.
Start Your Profit Diagnostic. If you want the same analysis run on your actual invoice data, SKU and customer axes both, with the fix math priced out, that is the first thing Revify’s Profit Diagnostic does. If you would rather implement the method with us than build the workbook alone, that is the place to start.
About the author: Enrico Sieni has over twenty years of experience in pricing and revenue growth for manufacturers and distributors, and has built three pricing teams from the ground up. His experience shows that most mid-market companies do not require a dedicated pricing department, but rather need the pricing work completed effectively. Revify delivers this service, with weekly tracking of realization and decisions based on invoice-level data.
Distributor pricing benchmarks answer the one question your ERP cannot: how does my pricing compare to other distributors my size? This guide gives mid-market distributors and manufacturers six ratios to
On July 29, 2026 the Third Circuit reversed a lower-court dismissal and revived the antitrust case against Atlantic City casino-hotels and Cendyn’s Rainmaker pricing software. Originally published on the Revify
US ports are projected to handle a record 2.47 million containers in July 2026, yet Drewry counts carriers blanking 6–8 transpacific sailings anyway, with rates up more than $3,000/FEU since