Originally published on MyRevify.com — republished here for the Pricing Lever audience.
Repairing a manufacturer customer portfolio tail recovered $130K of margin without losing volume through elasticity-aware pricing.
Overview: Customer Portfolio Tail Repair
This case study shows how repairing the customer portfolio tail recovered $130K in annualized margin for a manufacturer — without losing volume — by combining statistical rigor with elasticity-aware pricing moves. The customer portfolio tail was isolated into 100 break-even and 252 low-GM accounts, then cross-referenced against machine learning customer segmentation to distinguish genuine low-value accounts from strategic ones. The engagement proves that the customer portfolio tail is rarely untouchable: with elasticity evidence, leaders can act on the tail confidently and make portfolio tail monitoring a permanent part of the monthly commercial review. See the full case study below, or read our related case study on Turning Loss-Making Customers into Margin.
Client Situation
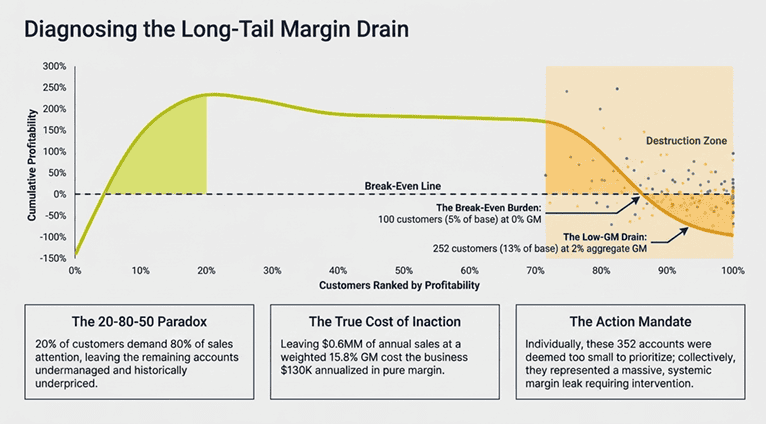
Underneath the manufacturer’s healthy aggregate margin sat a sizeable ‘tail’ of underperforming accounts: 100 customers (5% of the base, 0.6% of sales) transacting at essentially break-even margins, and another 252 customers (13% of the base, ~3% of sales) at an aggregate 2% GM.
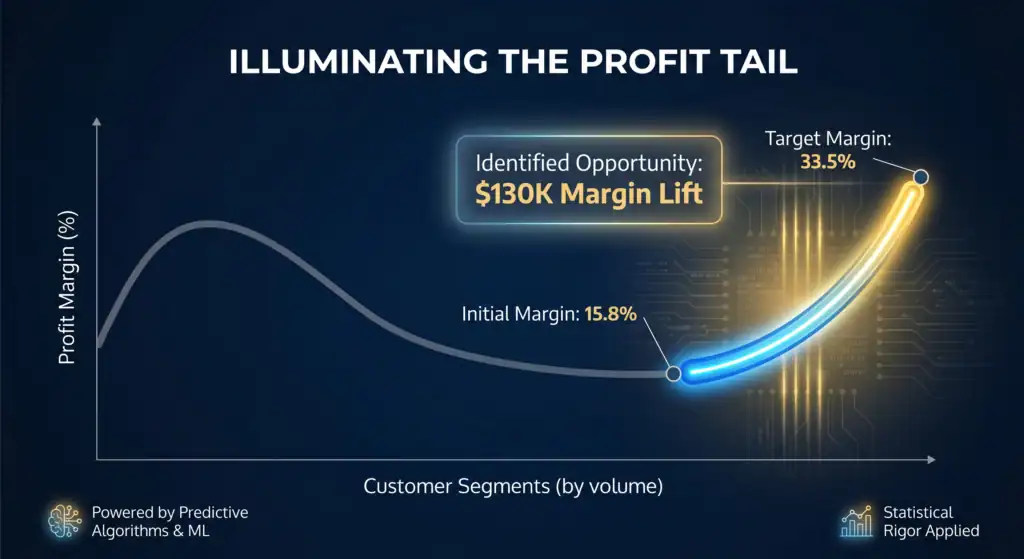
The low end of the portfolio represented about $0.6MM of annual sales at a weighted 15.8% gross margin — well below the business’s ~33.5% company average.
The commercial team had flagged the issue historically but struggled to act: without elasticity evidence, raising prices risked losing volume, and the tail was small enough individually that ‘nothing to do’ had become the default.
The Revify Approach
Segment — Isolate the Tail With Statistical Rigor
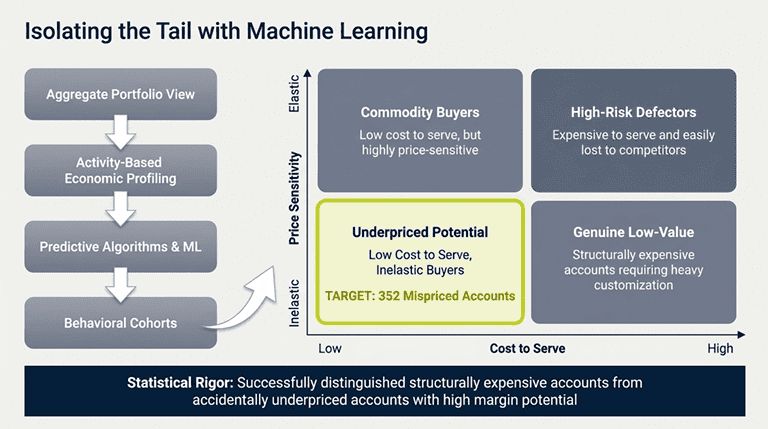
- Identified all 100 break-even customers and 252 low-GM customers as distinct cohorts with different economic profiles and outreach requirements.
- Cross-referenced the tail against Machine Learning customer segmentation to distinguish genuine low-value accounts from accidentally-underpriced customers with real potential.
Simulate — Elasticity-Informed Margin Lift
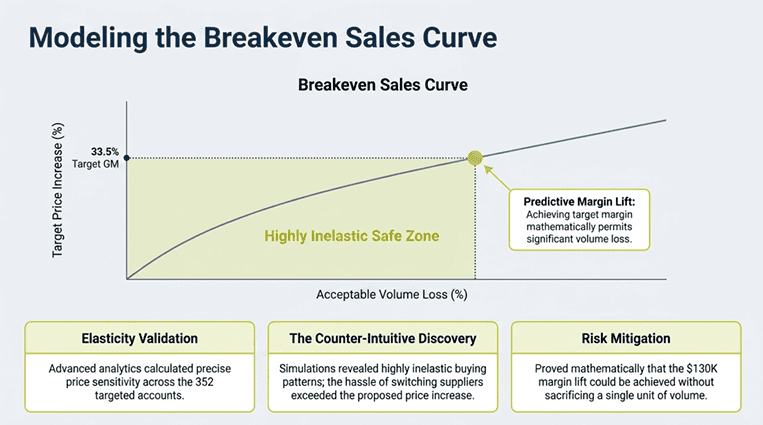
- Ran elasticity-aware simulations to model the volume response of moving the low end of the portfolio to align with the 33.5% company GM average.
- Critically, the simulation showed the margin lift could be achieved without sacrificing any volume, given the inelasticity of these accounts’ buying patterns — a genuinely counter-intuitive result that was only visible with elasticity modeling.
Execute — Multi-Pass Roll-Out
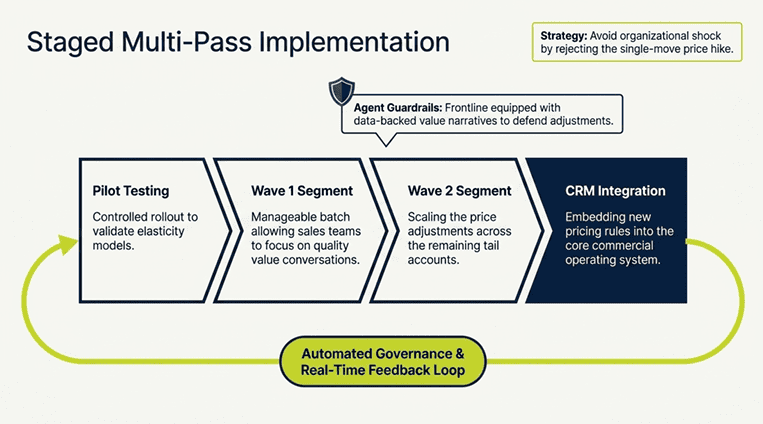
- Recommended a staged, multi-pass implementation given the size of the step-up required — rather than a single-move price shock.
- Built the ongoing monitor to prevent new low-GM customers from accumulating in the tail going forward.
Key Findings & Results
Moving the low-margin portfolio tail to the 33.5% company GM average was projected to add $130K of gross margin — with the counter-intuitive but elasticity-validated conclusion that no volume needed to be sacrificed to realize it.
An additional strategic win: the tail is now a monitored segment, not a blind spot. New accounts entering the low-GM cohort are flagged in-cycle for sales review before they become entrenched.
| IMPACT DIMENSION | QUANTIFIED BENEFIT |
| Gross margin lift (tail only) | +$130K annualized |
| Volume attrition modeled | Zero |
| Break-even customers addressed | 100 customers (5% of base) |
| Low-GM customers addressed | 252 customers (13% of base) |
| Weighted GM% of tail (before) | 15.8% |
| Target GM% (company average) | 33.5% |
Why This Matters
| Inaction is never free. Every quarter that 352 customers stayed at 2% or break-even margins was $130K of annualized margin the business was voluntarily leaving on the table. Elasticity evidence is what finally made the decision safe to execute. |
Conclusion
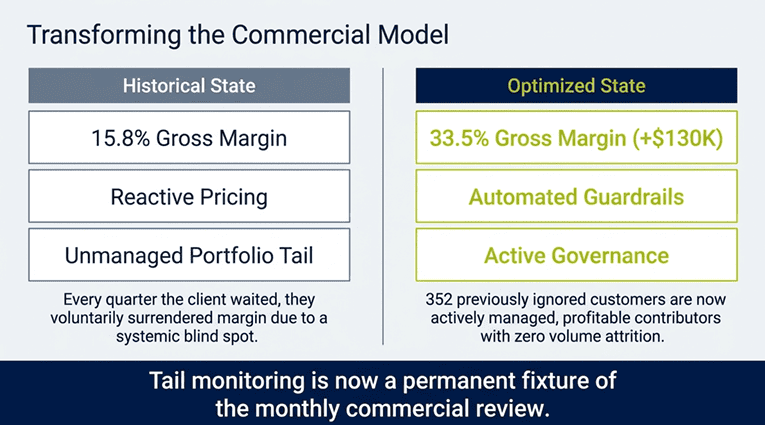
What looked like a small, untouchable problem turned out to be a $130K annualized margin opportunity that, critically, did not require a volume trade-off. The engagement removed the hesitation that had kept the issue unresolved for years.
Portfolio tail monitoring is now a permanent fixture of the client’s monthly commercial review.
Related Case Studies
- Turning Loss-Making Customers into Margin: $0.7MM Gross Margin Lift at a Mid-Market Distributor
- Stemming the Flow: $1.5–$3MM in Sales Recovery Through Customer Retention
Further reading
For broader industry perspective on revenue growth management and pricing analytics, see McKinsey’s Growth, Marketing & Sales insights.